It seems that the markets are up for a major test, as the USD approaches multi-year resistance levels…will it?
The relentless USD rally over the past months has caught me off guard. It feels it was massive, and it was quite a long 10 week streak! But zooming out, to multi-year retrospective, it was… still, rather a moderate rise.
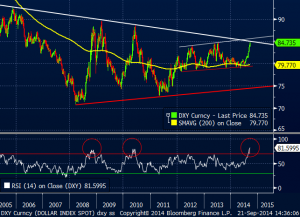
Now the USD (DXY) index, again, is less than 1% away from 85.30/50 levels, where multi-month uptrend and multi-year downtrend clash. That is, the chances of a reversal as it approaches those levels rise… just as the expected change, in both the case of the break up, and the reversal.
Figure 1. USD up for a test
What would the break up imply for USD crosses?
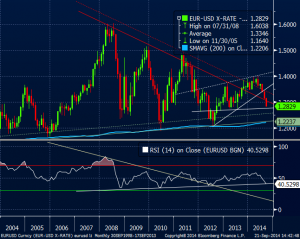
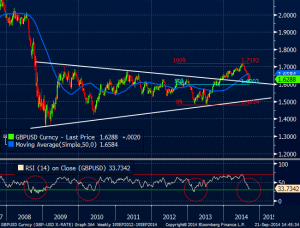
Technically, the break below 1.2730/40 for EURUSD, next support, to levels much lower, 1.22/23. GBPUSD? Also, sharp reversal to the channel, breaking the 50% retracement from 2015 high, toward 1.50. And the USDJPY would explode above 110.7, high of 2008. As regards other currencies, it will very likely imply much weaker commodity currencies and EMs, in particular the Asian camp (KRW, SGD, THB…).
Figure 2. Below 1.2730/40…a hole
Figure 3. GBPUSD support at 1.60, below which…toward 1.50
Now, is this to happen? May the charts above be your guides. Our current official 3M FX forecasts do not envision this happening on a permanent basis yet, nor do I think it will, here and now. But…what if?
No. More importantly…what does it take?
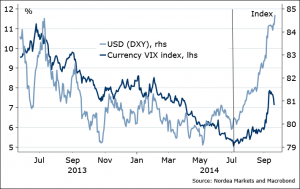
Well, one “usual suspect” is a rise in volatility, which has helped the USD over the past few months. It could be either due to rates shock on great US news, prompting further Fed funds reprising, or major macro disappointments, causing stock markets to correct. We have seen somewhat higher FX volatility since summer, notably the GBP volatility last week, but that is off for now. What next?
Figure 4. Volatility is USD trend-friend
Fed speak? We got a looot this week, as almost everyone gets a chance for “mark to dots”. Watch especially the neutral 2015 voters clarifying their views, notably Dudley (Monday), Lockhart (Wednesday), the guys who will have to execute the promised plan to hike Fed funds from June’15. Anything along the lines of “market underpricing us” would be volatility-creating.
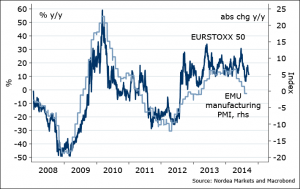
Data? This week’s US data is not quite Tier-1. The US revised Q2 GDP is expected to come out at 4.6% pa (Friday), but the recent survey data is more important. The Chinese PMIs are, in particular: after the previous disappointment, prevailing hope is that we will see a number above 50, just. Too bad if not. From Europe, also flash PMIs on Tuesday, expected around last month’s levels. Little indication for why it should disappoint (also our official view), but if they do a bit, probably less important now that the we got used to worsening EMU data.
Figure 5. Should hold on
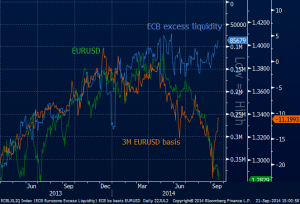
Liquidity? Matters a lot, of course, too. The more, the merrier! The ECB’s TLTRO is expected to bring excess liquidity up to around EUR 150bn this week, looks like a consensus by now. Maybe be we need to wait until the week after, October 2nd ECB meeting, to shed some light on major changes in global liquidity direction. After all, ECB that has promised a lot – but has yet to live up to their plan to bring the balance sheet up by around EUR 1 trillion.
Figure 6. Time to deliver for ECB
Markets broadly believe in strong USD by now. It’s THE test time of commitment.
Great trading opportunities around, either way.
Nordea

