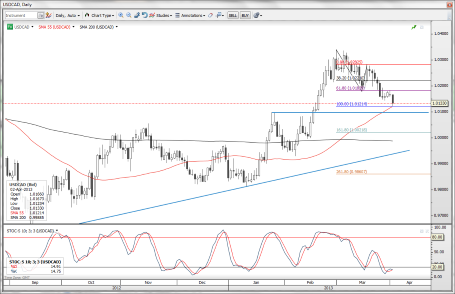
This “consolidation” in USDCAD from its 1.0300+ highs has been going on for a month now – it’s nearing the final near term zone of support here ahead of this week’s key events.
The USDCAD chart has now posted an orderly three way sell-off sequence, with the “C-wave” now having reached a 100% extension of the first sell-off wave. This level near 1.0125 also coincides with the 55-day moving average, which hasn’t been an interesting one in the recent past, but could be used as a technical level for convenience here. USDCAD weakening of late has been in sympathy with the generally risk-on environment, a sharp rally in WTI crude, and a couple of ugly data surprises out of the US over the last week while Canada’s data mix has improved after an incredibly ugly run in February and into early March.
Technically, this is a key area because of the completion of the extension wave lower, and because the zone toward 1.0100 is important for keeping the structural rally alive. Below that and we’re interacting with parity and the 200-day moving average, two critical levels. Since this consolidation has stretched on for so long now, bulls need to be patient and perhaps wait for a good technical reversal in the coming couple of days as we see if this technical area provides a pivot in the action. Besides a decent pattern reversal, a move back above 1.0185 would provide a reasonable signal that the chart is trying to find support here for a try back at the range highs above 1.0300.
SAXO BANK