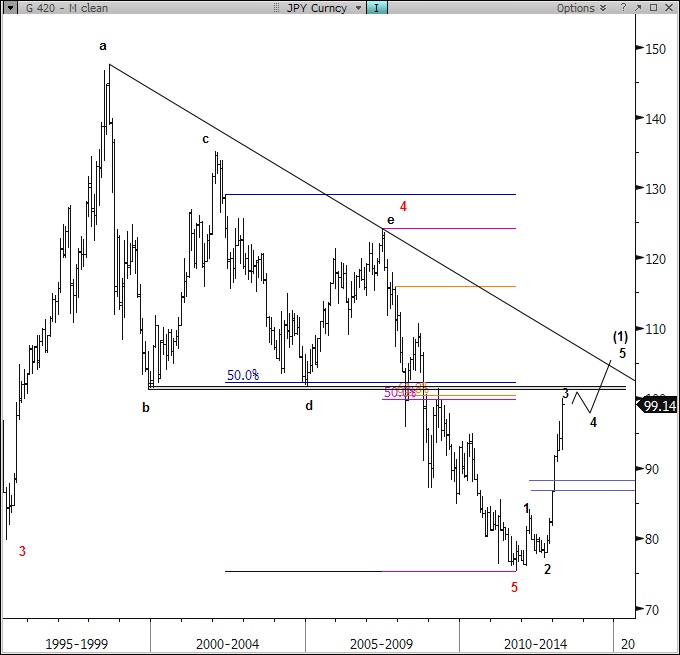
The long-term charts show a band of old support (now resistance) between 101.25-101-69. Further, a cluster of Fibonacci retracements has surfaced between 99.74-102.21. JPY has is still in an uptrend but the overhead resistance and valid 5-wave rally from 77 suggests that a correction is forming prior to the next wave up. (c1) S/t, the 3 wave sell-off to 95.80 and subsequent 3 wave rally to 99.90 argues that the correction from mid-April is incomplete. There is a possible double top forming at 99.95/90 and a smaller version at 99.90/76; both are coupled with bearish momentum divergences as well. The first signal to look for is a break of 98.98 support followed by a selloff through neckline support (the smaller double top) at 98.59. Levels: Support – 98.98, 98.60, 97.22 Resistance – 99.24, 99.76, 99.95
Natixis